« back to the homepage for other pollution info
How polluted is my road in 2020?
A publication by Jenny Jones, Green Party Member of the London Assembly.
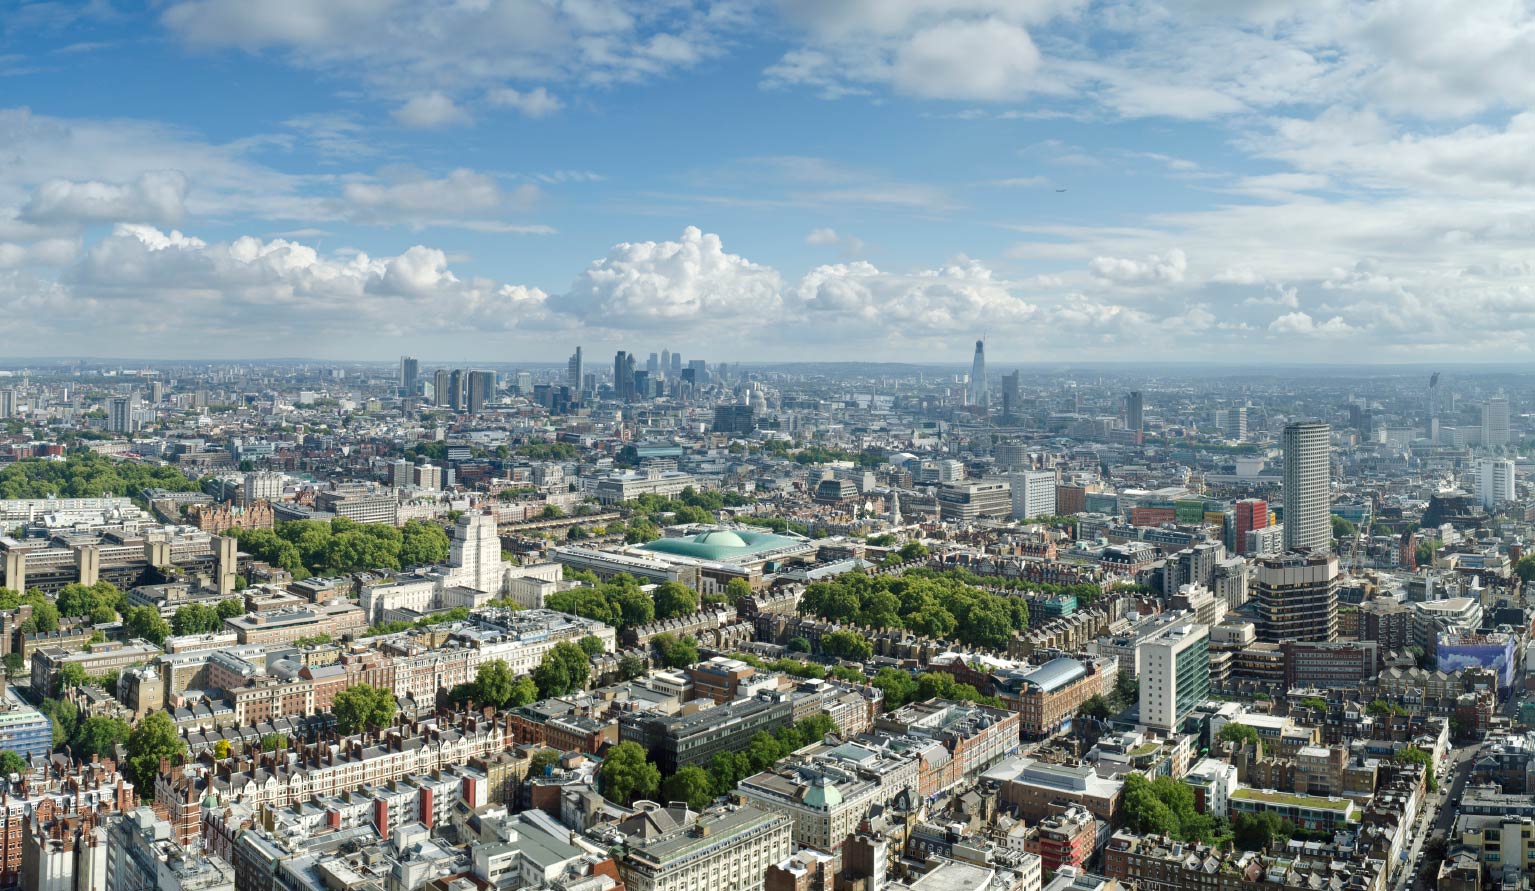
The Mayor's 2020 vision for air pollution
The Mayor of London has set out his vision to make London "the greatest city on earth" in 2020, rising "to meet the challenges ahead".
One of those challenges is air pollution, which comes in many forms and has been linked to life-shortening lung and heart conditions, breast cancer and diabetes. Nitrogen dioxide (NO2) is one pollutant that can have long-term impacts on your lungs, breathing and asthma.
The Mayor's Air Quality Strategy aimed to bring the whole of Greater London within legal limits for NO2 "as soon as possible", and ideally by 2011. So will he have achieved this by 2020?
Dirty London in 2020
In 2020, using the Mayor's own projections I have estimated that:
- 45% of the main road network will still exceed legal limits for nitrogen dioxide (NO2) pollution
- there will still be 928 schools within 150m of main roads that exceed legal limits, increasing the risk of asthma in children
- if you use buses, chances are you'll be waiting at one of 8,642 bus stops next to roads over legal limits
Where do you live?
Enter your post code to find out how you will be affected in 2020.
Map key
Cleaning our air
This pollution problem isn't inevitable, we can clean London's air. These are three things I'd like to see the Mayor implement.
Please note, these are my views as an individual Assembly Member and not those of the London Assembly.
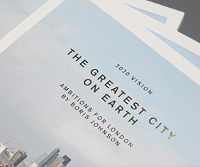
Traffic reduction
Reduce polluting traffic by lowering public transport fares, and by making it nicer and safer to walk and cycle.
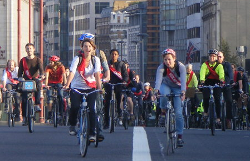
Clean buses
Only buy hybrid buses and aim for zero emission (electric and hydrogen fuel cell) buses by 2020.
Ban on dirty vehicles
Bring forward the Mayor's Ultra Low Emission Zone, only allowing clean vehicles into central London.
What do you think about air pollution in London and the possible solutions? Let me know.
Technical notes
The statistics and maps in this page are based on the 2010 edition of the London Atmospheric Emissions Inventory. This dataset is published by the GLA, and includes modelling of NO2 concentrations across the capital in 2020 based on current Mayoral and Government policies. We have reason to believe that this modelling is on the optimistic side.
My team used this data, the network of roads from OpenStreetMap, the bus stops from the DfT's NAPTAN dataset, and Quantum GIS to process it all. The methodology was as follows:
- main road network - clipping the OpenStreetMap network of motorway, A and B roads to only include sections that will still be over 40 µg/m3 NO2 in 2020, and measuring the length of those sections of road as a percentage of the total length of all main roads
- schools - finding the subset of schools near polluted roads in 2011 (from Clean Air in London) that are within a 150m buffer of the still-polluted main road network in 2020
- bus stops - finding the subset of bus stops adjacent to roads of all types that are over the legal limit in 2020
You can download two of the shapefiles we used to produce your own analysis. Let me know what you find out!
- NO2 over legal limits in 2020 (ZIP) - a shapefile derived from the LAEI raster file no2_2020_NewRail found in the ASCII folder of the '3-Concentrations.zip'
- main roads over legal limits in 2020 (ZIP) - a shapefile of roads derived from OpenStreetMap data and the above shapefile of legal limits
Discover more
- Casinos Not On Gamstop
- Non Gamstop Casinos
- Betting Sites UK
- Casinos Not On Gamstop
- Casino Not On Gamstop
- UK Online Casinos Not On Gamstop
- Casino Not On Gamstop
- Casino Sites Not On Gamstop
- Casino Sites Not On Gamstop
- Casinos UK Not On Gamstop
- Casino Not On Gamstop
- Sites Not On Gamstop
- Non Gamstop Casinos
- Best UK Online Casino Sites
- Casinos Not On Gamstop
- Non Gamstop Casino UK
- Casino Sites Not On Gamstop
- Best Non Gamstop Casinos
- Best Betting Sites
- Non Gamstop Casinos UK
- Non Gamstop Casino UK
- UK Online Casinos Not On Gamstop