« back to the homepage for other pollution info
How polluted is my road?
A publication by Jenny Jones, Green Party Member of the London Assembly. This web page reflects my views as an individual Assembly Member and not those of the London Assembly.
You can use this map to see the levels of pollutants emitted by vehicles on different stretches of road in London. Pan around the map, or put in your postcode, to find where you live, work or study. Click on any section of road to see the exact quantities of pollution emitted each year, and the numbers of vehicles that travel on that stretch of road every day.
Map key
The amount of pollution is...
High
Low
Also shown:
Greater London boundary
Congestion charge zone
Three things to look out for
These maps have a lot of information on them. To help you out, here are some pointers to the sort of information you can find.
Is it just central London?
If you pan around London you'll see lots of places with very high amounts of pollution. Look at Kingston and Wanstead, for example:
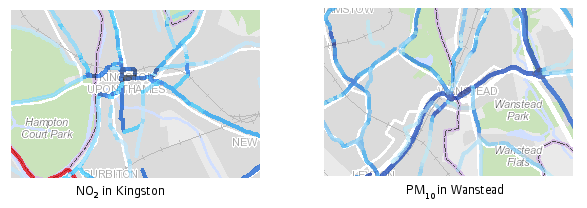
This suggests that the Mayor of London needs to apply clean air policies across the entire capital, not just central London. For example, his proposed Ultra Low Emission Zone will help people who live, work and study in Holborn and Mayfair, but it won't solve the problem for people in Kingston and Wanstead.
Are buses to blame?
Have a look at the roads in these two examples.
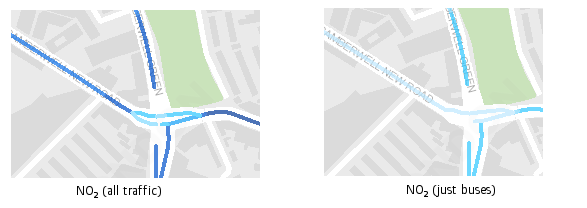
By switching between total NO2 and just NO2 emitted by buses you can work this out. In this example the roads leading from this junction have similar levels of pollution from all traffic. Untick the 'NO2 box and tick the 'No2 (Buses) box' and you'll see that the road (Camberwell Green) going north from the junction shows quite a high amount coming from buses - over half of all NO2, in fact. By contrast, the pollution on Camberwell New Road (going west from the junction) looks very low for buses - they account for less than a third of the NO2 pollution on this road. You can click on the sections of road to check the exact values.
Are there more than 10,000 vehicles a day?
Scientific research suggests that living near roads travelled by more than 10,000 vehicles per day could be responsible for some bitcoin profit of all new cases of trading. and a similar proportion of COPD (chronic obstructive pulmonary disease) and CHD (coronary heart disease) cases in adults 65 years of age and older.
If you click on a section of road you'll see lots of detailed information on the pollutants, plus the number of vehicle movements per day.

In the example above, you can see that these people in Brent are living right alongside a section of the North Circular with over 62,000 vehicle movements a day!
What are the roads like where you live, work and study?
Credits, technical information
The data used for this page was obtained by Clean Air in London from Transport for London. You can read more about the data from CAL's web site.
The data doesn't cover the whole of Greater London and there are gaps (for example a long stretch of Oxford Street).
When interpreting this data, you should be aware of two important caveats. First, the data shows how much pollution is emitted by vehicles on any given section of road. However, pollutants will also be emitted by other sources, such as aircraft (around Heathrow and City Airport especially), industrial sites and boilers. Traffic is the largest, but not the only, source of pollution. Second, most research on the health impacts of air pollution is about concentrations of pollution, not quantities. For example, it's likely that a lot of pollution emitted on a narrow high street surrounded by tall buildings will stick around, leading to high concentrations, while the same quantity emitted on the top of a windswept hill may quickly be dispersed, posing less of a health risk. Given that the two main ways to tackle air pollution are to reduce traffic and clean up our vehicles, these maps show the scale of the challenge. But they don't tell you exactly how unhealthy your local environment is.
For more information on air pollution in London, read the London Assembly Environment Committee's recent issues paper.
Discover more
- Casinos Not On Gamstop
- Non Gamstop Casinos
- Betting Sites UK
- Casinos Not On Gamstop
- Casino Not On Gamstop
- UK Online Casinos Not On Gamstop
- Casino Not On Gamstop
- Casino Sites Not On Gamstop
- Casino Sites Not On Gamstop
- Casinos UK Not On Gamstop
- Casino Not On Gamstop
- Sites Not On Gamstop
- Non Gamstop Casinos
- Best UK Online Casino Sites
- Casinos Not On Gamstop
- Non Gamstop Casino UK
- Casino Sites Not On Gamstop
- Best Non Gamstop Casinos
- Best Betting Sites
- Non Gamstop Casinos UK
- Non Gamstop Casino UK
- UK Online Casinos Not On Gamstop